Stocks corrected in February as the world grappled with Trump’s oscillating policy announcements. A flight to safer assets resulted in treasuries outperforming and the 10-year US Treasury yields came down 33bp during the month. US HY spreads widened due to the risk-off sentiment but by lesser than the move in USTs, with the HY average OAS widening only 19bp. As a result, fixed income assets performed well overall.
Lenses of History
As uncertainties increase with respect to Trump’s economic policies and their impact on the US economy, the probability of slower US growth or even recession has increased. This is getting reflected in stock markets. However, we feel that credit markets are not yet pricing in these risks.
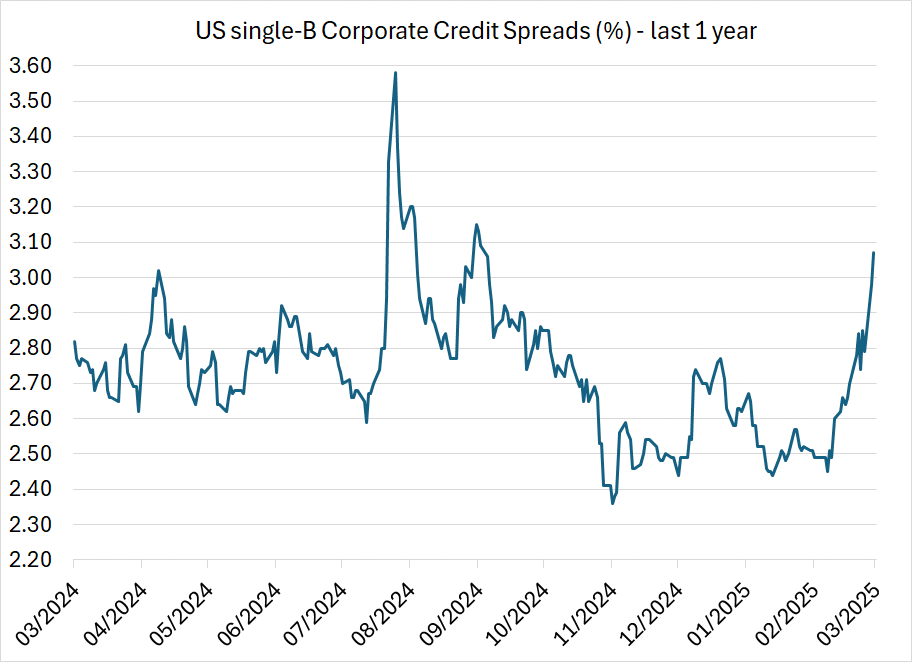
Some investment managers having fee generating dry powder may consider the recent spread widening as sufficient to jump into higher yielding bonds or support weak companies with private credit loans. If we look at the 1-year chart of single-B rated US corporate credit spreads (see below), it may seem that barring a short period in the summer of 2024, spreads are near the widest level of the last 12 months. This may seem like sufficient justification to “buy-the-dip”.

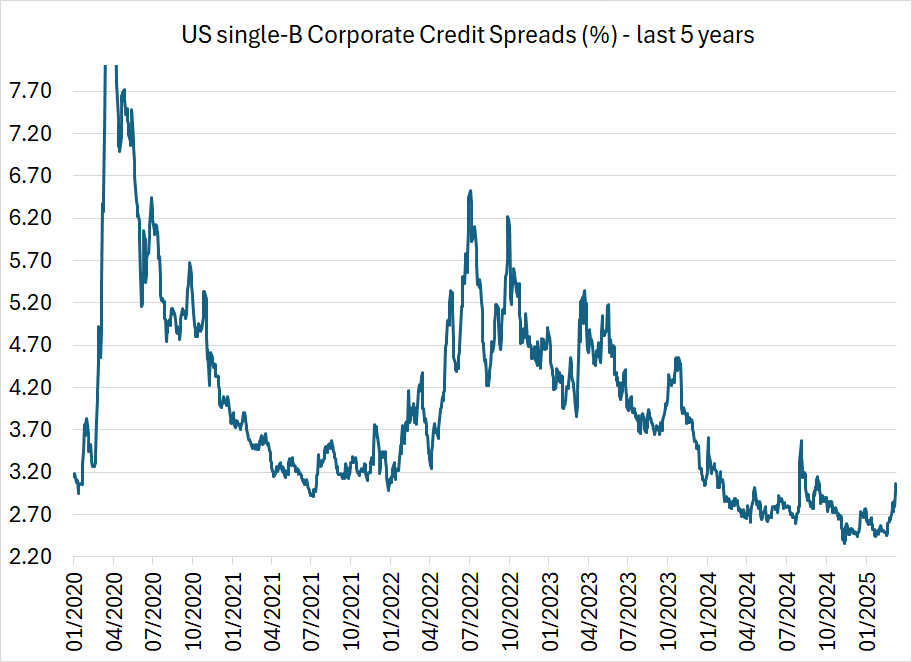
However, when we look at history with a wider lens like the 5-year chart of the same single-B credit spread index (see below), it will be obvious that we are quite far away from any meaningful cyclical cheapening in the credit markets. When fears of potential recession had taken hold in mid-2022 after the Fed started its campaign of rate hikes, single-B credit spreads had reached over 600bp, which is almost twice the current spread level. In that context, we should expect much more spread widening before the markets seem cheap enough.

When policy uncertainties increase, corporates are likely to defer their CapEx and hiring plans. However, this cautious approach will take time to show up in the reported economic data as the slower growth in spending feeds upwards through the extensive supply chains. Furthermore, if global trade gets disrupted due to tariff barriers introduced by many countries, it could be one of the major turning points of global economic growth and stability.
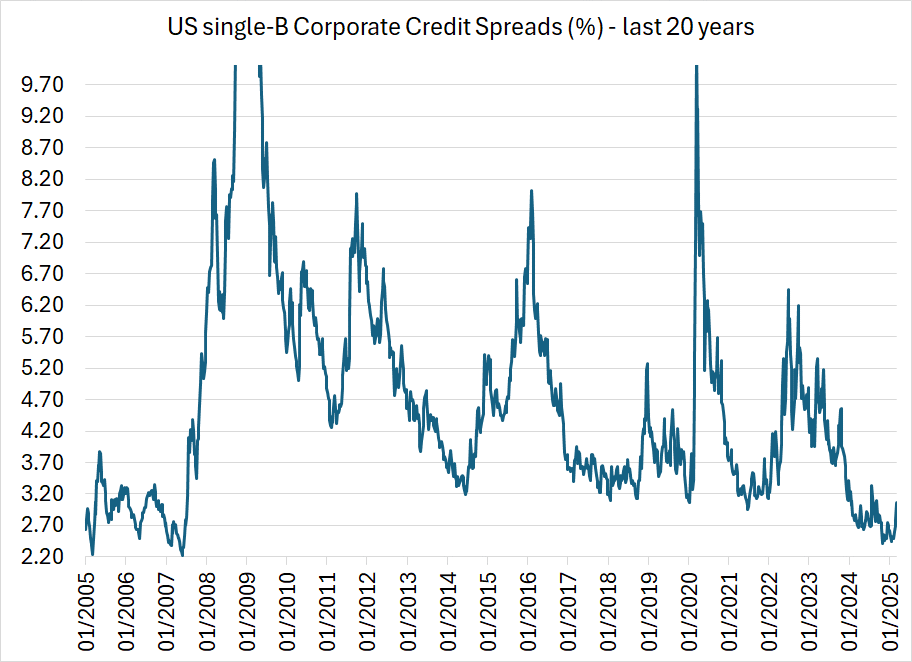
In recent decades, major turning points in the markets have happened every 4-5 years. The single-B credit spread chart when viewed from a 20-year lens (see below), shows the movements in spreads through such turning points. Looking at this chart, the recent move wider in spreads looks very insignificant.


